


Ichimoku Kinko Hyo. Yes, it is a Japanese term, and it is about trading. If we translate it, the word Ichimoku means a glance, Kinko means equilibrium, and Hyo translates to chart. If we add all of these Japanese terms, we will come up with Ichimoku Kinko Hyo that translates to “a glance in equilibrium.” It sounds interesting because it is!
What is Ichimoku Kinko Hyo?
If you find Ichimoku Kinko Hyo hard to pronounce or memorize, you can always use its shorter version — IKH. IKH is also a technical indicator that tells us about the price momentum’s future. It also tells us where we can find support and resistance levels in the future. If you plan to use the IKH, we should let you know that it is best to use this indicator on JPY currency pairs.
The IKH components
This indicator’s name might sound like a bit of a challenge for some. Some may also find it slightly hard to understand. Let us make it simple for you:
- We can use IKH in all types of assets and any timeframes.
- We can use IKH in a rising or falling market.
Even though it seems like we can use IKH for all conditions, we cannot use it when there is no clear trend.
The IKH Lines
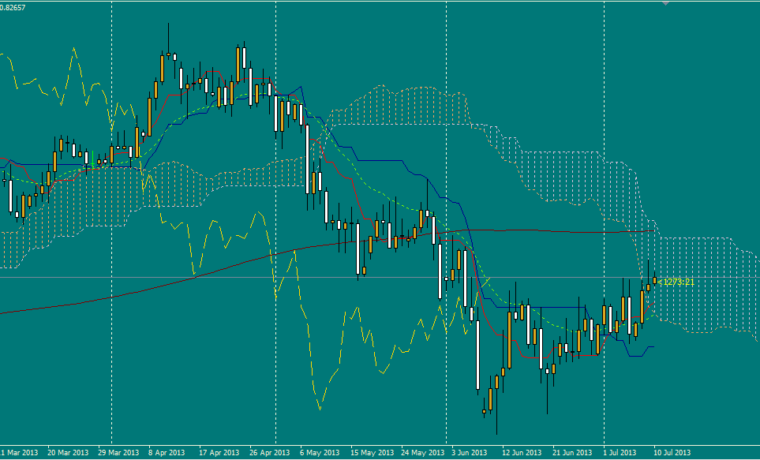
We will encounter different kinds of lines in IKH. Let us enumerate them one by one and their meanings. Before we start, know that there is no need to memorize how we calculate them. The important thing is knowing how to interpret them.
- Kijun Sen/ Blue line. This line is also known as the standard or baseline. We calculate it by getting the average of the highest high and lowest low of the most recent 26 periods.
- Tenkan Sen/ Redline. This line is also known as the turning line. We calculate it by getting the average of the highest high and lowest low of the most recent nine periods.
- Chikou Span/ Greenline. This line is also called the lagging line. This is the current closing price and plotted on the last 26 periods.
- Senkou Span/ Orange lines. We can derive this by getting the average of the Tenkan Sen and Kijun Sen, and the plotting is 26 periods ahead.
- The second Senkou line. We can derive this by getting the average of the highest high and the lowest low of the most recent 52 periods. The plotting is 26 periods ahead.
Trading with IKH
Let’s start with the Senkou Span. Once the price sets foot higher than the Senkou span, the top line will be the first support level, and the bottom line will serve as the second support level. On the other hand, if the price went below the Senkou span, the bottom line will serve as the first resistance level, and the top line will now serve as the second resistance level.
For Kijun Sen, it will be an indicator of the price movement’s future. If the price is more than the blue line, it will most likely continue to go higher. If the price is lower, then it will go down continuously.
Tenkan Sen indicates the market trend. It’s a trending market if the red line moves up and down. It’s a ranging market if the red line moves horizontally.
And finally, we have the Chikou Span. It is a buy signal if it will cross the price in a bottom-up direction, and it’s a sell signal if it passes in the top-down direction.
Final thoughts
Thanks to IKH, we can avoid getting on the wrong side of the market when we follow trends. It is a combination of support and resistance levels, oscillators, crossovers, and trend indicators. We can use it in any market condition, and it reminds us to trade in the same direction of the trend — not against it!